GoogleMap
The GoogleMap controller renders an interactive Google Maps view with markers positioned via client-side geocoding of address fields from the database. It includes an optional data grid sidebar with a draggable splitter, similar to the ChartPanel layout.
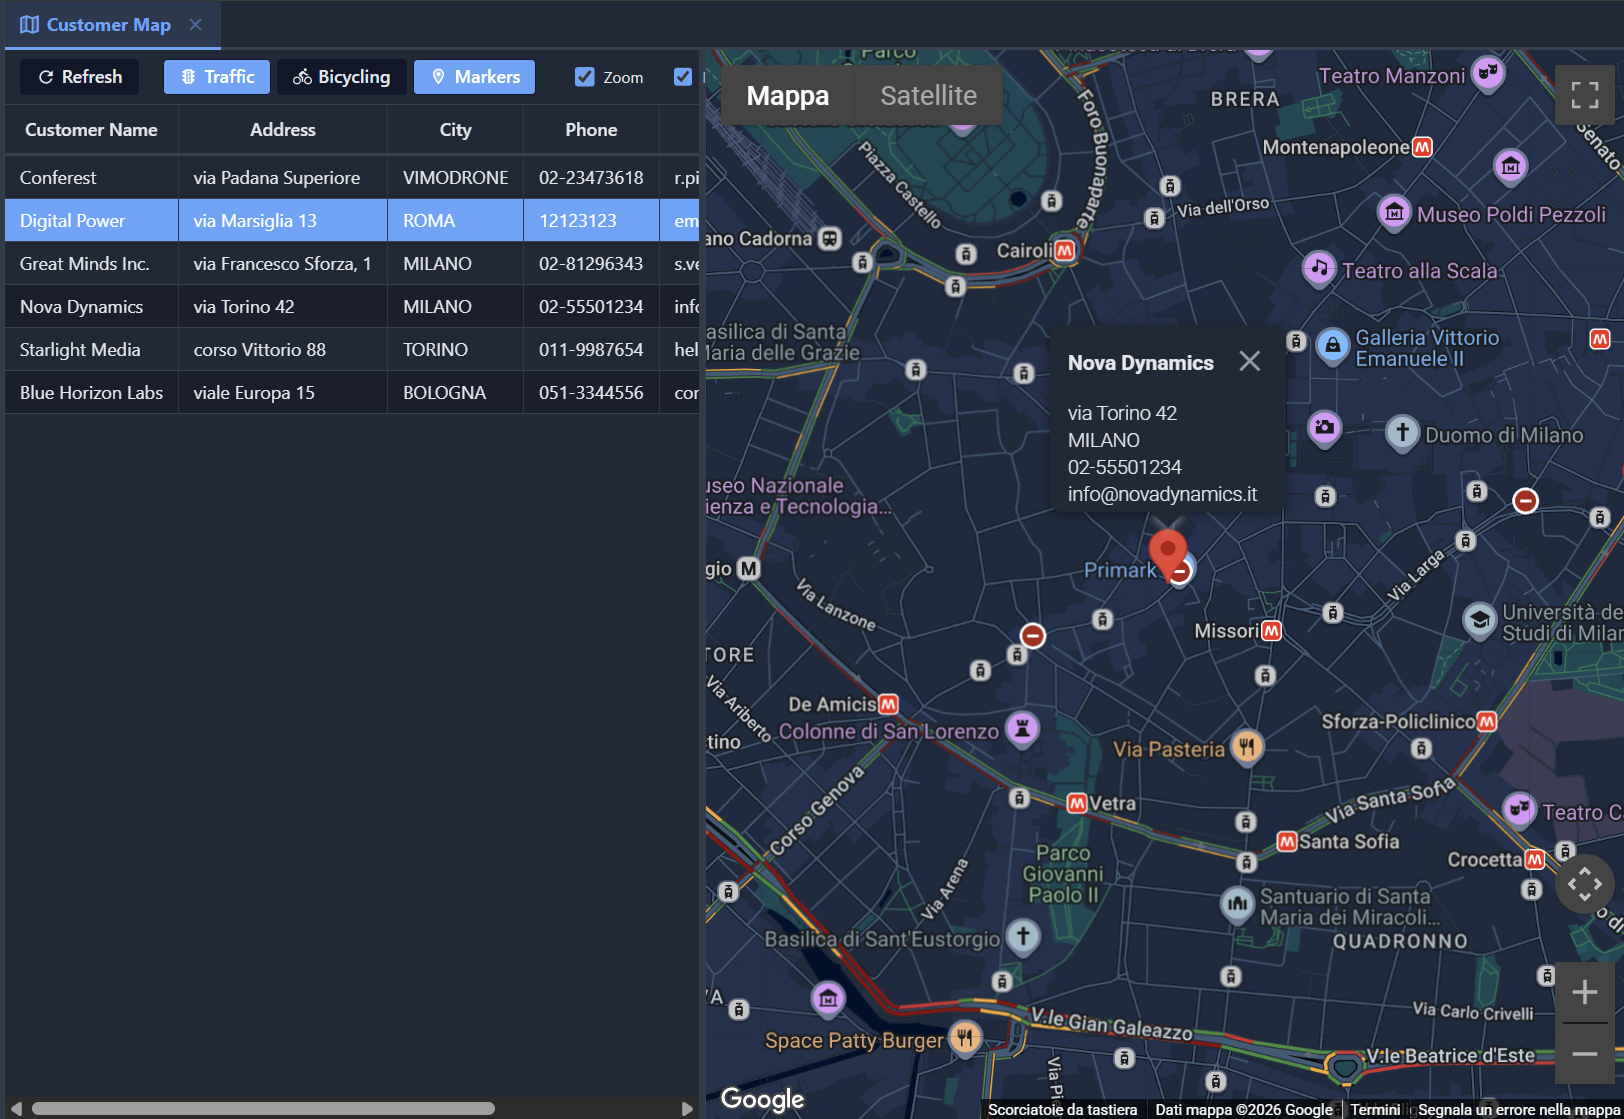
The GoogleMap controller is a standalone data panel (Controller: GoogleMap) that reads model records, concatenates address fields for geocoding, and displays the results as map markers. Clicking a marker shows an InfoWindow with record details; clicking a grid row centers the map on the corresponding marker.
Obtaining a Google Maps API Key
The GoogleMap controller requires a Google Maps API key. To obtain one:
- Go to the Google Cloud Console
- Create a new project (or select an existing one)
- Navigate to APIs & Services > Library
- Enable the following APIs:
- Maps JavaScript API — required to display the map
- Geocoding API — required to convert addresses to coordinates
- Directions API — only needed if using routing features
- Navigate to APIs & Services > Credentials
- Click Create Credentials > API Key
- (Recommended) Restrict the key to your application's HTTP referrers
API Key Security
The API key is embedded in the web page and visible to users. Always restrict it to specific HTTP referrers in the Google Cloud Console to prevent unauthorized use. Never use an unrestricted key in production.
Configure the key globally in Config.yaml:
GoogleMapsApiKey: AIzaSy...your-key-hereIndividual views can override the key via the GoogleMap/ApiKey node.
Basic usage
Type: Data
Controller: GoogleMap
  GoogleMap:
    Zoom: 6
    Center:
      Latitude: 41.9028
      Longitude: 12.4964
    MapTypeId: ROADMAP
    MapControls:
      Zoom: True
      MapType: True
      FullScreen: True
      StreetView: False
    MapView:
      Traffic: False
      Bicycling: False
      Markers: True
    SidebarPosition: West
    SidebarWidth: 600
    AddressFields: ADDRESS, CITY
    TitleField: CUSTOMER_NAME
    InfoFields: CUSTOMER_NAME, ADDRESS, CITY, PHONE, EMAIL
MainTable:
  Model: CUSTOMER
DisplayLabel: Customer Map
ImageName: map
The controller geocodes each record's address (built by concatenating the fields listed in AddressFields) and places a marker on the map. The TitleField is displayed as the InfoWindow header, and the remaining InfoFields (excluding the title field to avoid duplication) form the InfoWindow body.
Map configuration
Map options are defined under the GoogleMap node:
| Property | Default | Description |
|---|---|---|
ApiKey | from Config.yaml | Google Maps API key (overrides the global GoogleMapsApiKey) |
Center/Latitude | 0 | Initial map center latitude |
Center/Longitude | 0 | Initial map center longitude |
Center/Address | Initial center by address (geocoded, used when lat/lng are 0) | |
Zoom | 12 | Initial zoom level (1 = world, 20 = building) |
MapTypeId | ROADMAP | Map type: ROADMAP, SATELLITE, HYBRID, TERRAIN |
Height | 0 | Map height in pixels (0 = fill available space) |
MapControls
The MapControls node defines which UI controls are displayed on the map. These can also be toggled at runtime via toolbar checkboxes:
| Property | Default | Description |
|---|---|---|
Zoom | True | Show +/- zoom buttons on the map |
MapType | True | Show Map/Satellite toggle on the map |
FullScreen | True | Show fullscreen button on the map |
StreetView | False | Show Street View pegman on the map |
GoogleMap:
  MapControls:
    Zoom: True
    MapType: True
    FullScreen: True
    StreetView: False
MapView
The MapView node defines which layers and features are active by default. Each feature has a corresponding toggle button in the toolbar that the user can click to enable/disable at runtime:
| Property | Default | Description |
|---|---|---|
Traffic | False | Show real-time traffic overlay |
Bicycling | False | Show cycling paths overlay |
Markers | True | Show/hide all markers on the map |
GoogleMap:
  MapView:
    Traffic: False
    Bicycling: False
    Markers: True
The toggle buttons in the toolbar are highlighted with the accent color when their feature is active.
Toolbar
The toolbar above the data grid provides:
- Refresh button — reloads both markers and grid data from the server
- Toggle buttons for each
MapViewfeature (Traffic, Bicycling, Markers) — click to activate/deactivate - Checkboxes for each
MapControl(Zoom, Map Type, Full Screen, Street View) — check/uncheck to show/hide controls on the map
All toolbar actions take effect immediately without reloading the page.
Sidebar configuration
The data grid sidebar is rendered automatically when the view has a MainTable/Model. The sidebar position and width are configured under the GoogleMap node:
| Property | Default | Description |
|---|---|---|
SidebarPosition | West | Sidebar position: West (left) or East (right) |
SidebarWidth | 400 | Sidebar initial width in pixels |
A draggable splitter between the sidebar and the map allows the user to resize both areas interactively.
Grid-map interaction:
- Click a grid row to center the map on the corresponding marker and open its InfoWindow
- Click a marker to highlight the corresponding row in the grid and scroll it into view
Marker configuration
Markers are positioned by geocoding addresses built from model fields:
| Property | Default | Description |
|---|---|---|
AddressFields | Comma-separated list of model field names concatenated to form the geocoding address (e.g., ADDRESS, CITY, COUNTRY) | |
TitleField | Model field displayed as the InfoWindow header (bold) | |
InfoFields | Comma-separated list of model fields displayed in the InfoWindow body. The TitleField is automatically excluded to avoid duplication |
Records with empty address fields are skipped (no marker placed).
Geocoding throttling
Google Geocoding API has rate limits. The client-side JS processes markers in batches of 5 with a 300ms delay between batches to stay within limits. For large datasets, consider storing lat/lng coordinates in the model and using those directly instead of geocoding.
Routing
The GoogleMap controller supports route calculation between two addresses via the Google Directions API (requires enabling the Directions API in Google Cloud Console). Add a Routing node under GoogleMap:
Controller: GoogleMap
  GoogleMap:
    Zoom: 6
    Routing:
      Origin: Rome, Italy
      Destination: Milan, Italy
      Mode: DRIVING
ShowDirectionsPanel: True| Property | Default | Description |
|---|---|---|
Routing/Origin | Start address or coordinates | |
Routing/Destination | End address or coordinates | |
Routing/Mode | DRIVING | Travel mode: DRIVING, WALKING, BICYCLING, TRANSIT |
ShowDirectionsPanel | False | Show turn-by-turn directions panel next to the map |
Data endpoint
The GoogleMap controller provides an automatic JSON endpoint for refreshing markers:
kx/view/{ViewName}/map-dataThe endpoint returns a JSON object with two properties:
{
  "markers": [
    {"address": "corso Vittorio 88, TORINO", "title": "Starlight Media", "info": "...", "idx": 0}
  ],
  "gridHtml": "<tr>...</tr>..."
}
The Refresh toolbar button triggers this endpoint to reload both markers and grid data.
TasKitto example
The TasKitto demo application includes a Customer Map view that displays all customers on a map, geocoded from their address fields.
Config.yaml
Add the Google Maps API key to the application config:
GoogleMapsApiKey: AIzaSy...your-key-hereCustomer model
The CUSTOMER model provides address fields used for geocoding:
ModelName: CUSTOMER
ImageName: shopping_bag
Fields:
  CUSTOMER_ID: String(32) not null primary key
    IsVisible: False
    DefaultValue: %COMPACT_GUID%
  CUSTOMER_NAME: String(40) not null
  ADDRESS: String(60)
  CITY: String(60)
  PHONE: String(20)
  EMAIL: String(60)
  STATUS: String(10)
    AllowedValues:
      Prospect: Prospect
      Active: Active
      Inactive: Inactive
DetailReferences:
  PROJECT: PROJECT
CustomerMap view
The view uses AddressFields: ADDRESS, CITY to build the geocoding address from two model fields. The MapControls and MapView nodes configure the initial state of controls and layers:
Type: Data
Controller: GoogleMap
  GoogleMap:
    Zoom: 6
    Center:
      Latitude: 41.9028
      Longitude: 12.4964
    MapTypeId: ROADMAP
    MapControls:
      Zoom: True
      MapType: True
      FullScreen: True
      StreetView: False
    MapView:
      Traffic: False
      Bicycling: False
      Markers: True
    SidebarPosition: West
    SidebarWidth: 600
    AddressFields: ADDRESS, CITY
    TitleField: CUSTOMER_NAME
    InfoFields: CUSTOMER_NAME, ADDRESS, CITY, PHONE, EMAIL
MainTable:
  Model: CUSTOMER
DisplayLabel: Customer Map
ImageName: map
Menu entry
Add the view to the navigation menu:
Folder: _(Customers)
  View: Customers
  View: Projects
  View: CustomerMap
Theme integration
The GoogleMap controller fully adapts to the current Kittox theme (light, dark, or auto):
Map rendering:
- Uses the native Google Maps
colorSchemeproperty:DARKwhen the theme is dark,LIGHTotherwise - Dark mode renders roads, water, parks, and labels with dark colors automatically (no custom styling needed)
- Theme detection checks
data-theme="dark"on the HTML element, with fallback toprefers-color-schememedia query for Auto mode
InfoWindow (marker popup):
- Light theme: white background, dark text (
#333) - Dark theme: dark background (
#1f2937), light text (#e5e7eb), dark scrollbars, light close icon - Header title adapts its color to match the current theme
- CSS overrides on Google Maps internal classes (
.gm-style-iw-*) ensure consistent dark styling
Sidebar grid and toolbar:
- Grid rows, headers, and hover states use
--kx-surface,--kx-text,--kx-border,--kx-row-hover - Active row highlight (when a marker is clicked) uses
--kx-accent - Toggle buttons use
--kx-accentbackground when active - The splitter follows the standard region splitter styling (
--kx-chrome-light)
See also
- ChartPanel — chart views with grid sidebar (same layout pattern)
- CalendarPanel — calendar views with event data
- List — tabular data grid
- Dashboard — composed views with multiple panels