Dashboard
The Dashboard controller extends FlexPanel with HTMX-based auto-refresh capability. It is designed to display KPI cards, charts, and summary views in a responsive grid layout that can automatically poll the server for updated data.
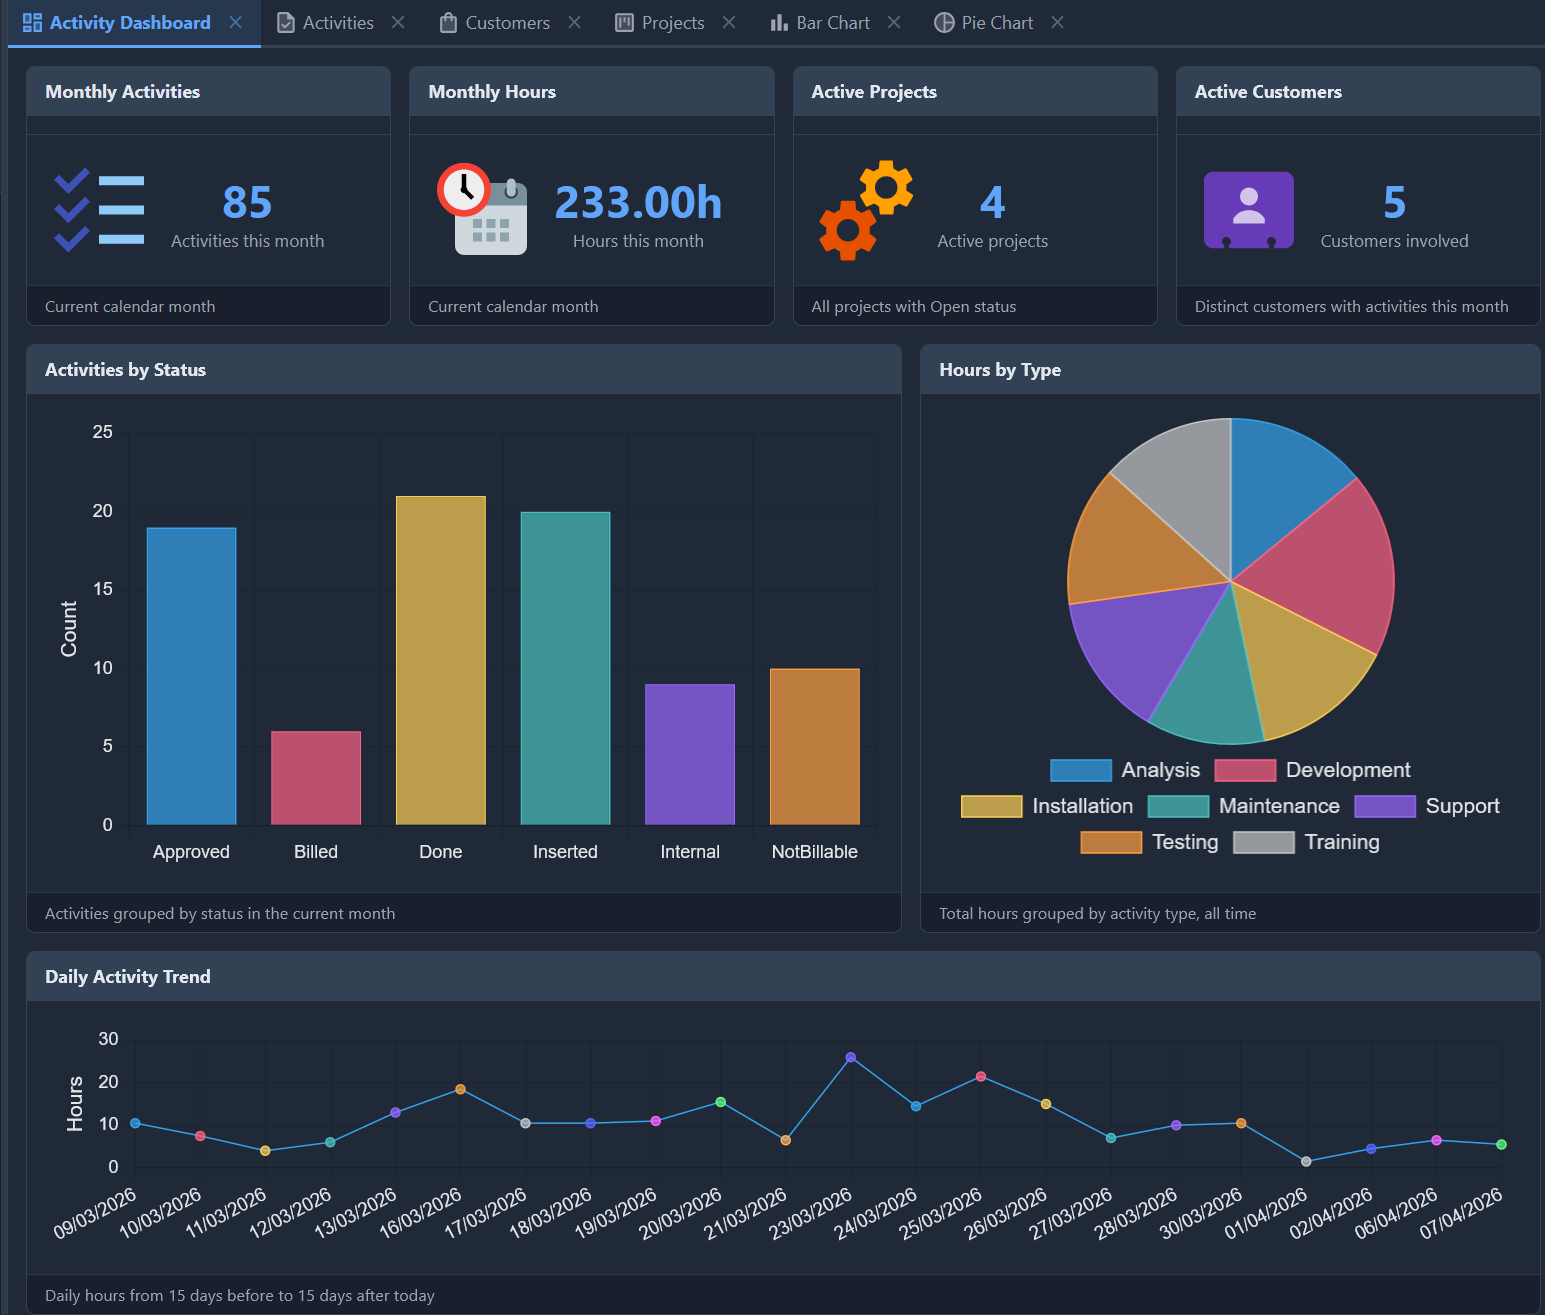
The screenshot above shows the TasKitto Activity Dashboard with four KPI cards in the first row, two chart views in the second row, and a daily trend chart spanning the full width at the bottom.
Configuration
Controller: Dashboard
  Gap: 12
  MaxColumns: 4
  RefreshInterval: 60
  Items:
    View: MyKpiView
      Flex: 1
      MinWidth: 180
      Height: 180
      Footer: _(Current month data)
    View: MyChartView
      Flex: 2
      MinWidth: 400
      Height: 350
      Footer: _(Activities by status)
Dashboard-specific properties
| Property | Default | Description |
|---|---|---|
RefreshInterval | 0 | Auto-refresh interval in seconds. 0 = disabled. When enabled, the entire dashboard content is re-fetched via HTMX polling |
All other properties are inherited from FlexPanel: Direction, Wrap, Gap, MaxColumns, JustifyContent, AlignItems, and Items.
Fixed heights for chart items
When a dashboard contains ChartPanel items, each item must specify a fixed Height in pixels. Without an explicit height, Chart.js cannot determine the canvas size and the charts will render incorrectly — especially after an auto-refresh.
KPI cards based on TemplateDataPanel should also have a fixed height for visual consistency:
Items:
  # KPI row — fixed height for consistent card sizing
  View: DashKpiActivities
    Flex: 1
    MinWidth: 180
    Height: 180
    Footer: _(Current calendar month)

  # Chart row — taller to give charts enough room
  View: DashStatusPie
    Flex: 2
    MinWidth: 400
    Height: 350
    Footer: _(Activities grouped by status)
WARNING
Without a fixed Height, chart items will collapse or resize erratically during auto-refresh. This is because Chart.js v4 reads the container dimensions at creation time; during an HTMX swap the flex layout may not have settled yet.
Auto-refresh mechanism
When RefreshInterval is greater than 0, a hidden <div> element is rendered with HTMX polling attributes:
<div hx-get="kx/view/{ViewName}"
     hx-trigger="every {Seconds}s"
     hx-target="closest .kx-tab-pane"
     hx-swap="innerHTML"
     style="display:none">
</div>
The polling replaces the entire tab pane content, re-rendering all child views with fresh data from the server. This is useful for dashboards displayed on wall monitors or kiosk displays.
After the HTMX swap settles, a global htmx:afterSettle listener in kxgrid.js calls .resize() on all active Chart.js instances (with a 150ms delay), forcing the charts to recalculate their dimensions from the now-stable flex layout.
TIP
Set RefreshInterval: 0 during development and enable it only in production to avoid unnecessary server load.
Building a Dashboard — TasKitto example
The TasKitto sample application includes a complete Activity Dashboard that demonstrates the typical dashboard pattern.
Step 1 — Database views for aggregated data
Create SQL views that aggregate your data into KPI-friendly structures:
-- Monthly KPI aggregates (returns 1 row)
CREATE VIEW VW_KPI_MONTHLY AS
SELECT
  (SELECT COUNT(*) FROM ACTIVITY WHERE ...) AS ACTIVITY_COUNT,
  (SELECT SUM(DURATION) FROM ACTIVITY WHERE ...) AS TOTAL_HOURS,
  (SELECT COUNT(*) FROM PROJECT WHERE STATUS = 'Open') AS ACTIVE_PROJECTS,
  (SELECT COUNT(DISTINCT CUSTOMER_ID) FROM ...) AS ACTIVE_CUSTOMERS

-- Activities by status (N rows, current month)
CREATE VIEW VW_ACTIVITY_BY_STATUS AS
SELECT STATUS, COUNT(*) AS ACTIVITY_COUNT, SUM(DURATION) AS TOTAL_HOURS
FROM ACTIVITY WHERE ... GROUP BY STATUS

-- Daily activity range (±15 days from today)
CREATE VIEW VW_ACTIVITY_DAILY_RANGE AS
SELECT ACTIVITY_DATE, COUNT(*) AS ACTIVITY_COUNT, SUM(DURATION) AS TOTAL_HOURS
FROM ACTIVITY WHERE ... GROUP BY ACTIVITY_DATE
Step 2 — Models for the aggregated data
Each SQL view needs a corresponding YAML model. Use PhysicalName to map to the database view name:
# Model: KPI_MONTHLY
Fields:
  ACTIVITY_COUNT: Integer primary key
  TOTAL_HOURS: Decimal(9, 2)
  ACTIVE_PROJECTS: Integer
  ACTIVE_CUSTOMERS: Integer
PhysicalName: VW_KPI_MONTHLY
Step 3 — KPI templates with
Create HTML templates for each KPI card. Use {_IMAGE} to render the view's icon as a full-color <img> (or {_ICON} for a monochromatic theme-colored icon):
<div class="kx-kpi-card">
  <div class="kx-kpi-icon">{_IMAGE}</div>
  <div class="kx-kpi-body">
    <div class="kx-kpi-value">{ACTIVITY_COUNT}</div>
    <div class="kx-kpi-label">Activities this month</div>
  </div>
</div>
The TasKitto dashboard uses flat-color SVG icons (e.g. todo_list.svg, overtime.svg, services.svg, business_contact.svg) placed in the project's Resources folder. The {_IMAGE} placeholder preserves the original SVG colors, while {_ICON} would render them monochromatic using the theme accent color. See TemplateDataPanel — Special placeholders for details.
Step 4 — KPI views using TemplateDataPanel
Each KPI card is a TemplateDataPanel view. The ImageName points to a flat-color SVG icon in the project's Resources folder:
Type: Data
DisplayLabel: _(Monthly Activities)
ImageName: todo_list.svg
Controller: TemplateDataPanel
  TemplateFileName: DashKpiActivities.html
MainTable:
  IsReadOnly: True
  Model: KPI_MONTHLY
Step 5 — Chart views
Use ChartPanel wrapped in a List controller for chart items:
Type: Data
DisplayLabel: _(Activities by Status)
Controller: List
  CenterController: ChartPanel
    Chart:
      Type: Cartesian
      Axes:
        Axis:
          Position: Left
          Title: _(Count)
        Axis:
          Type: Category
          Position: Bottom
      Series:
        Series:
          Type: Bar
          XField: STATUS
          YField: ACTIVITY_COUNT
MainTable:
  IsReadOnly: True
  Model: ACTIVITY_BY_STATUS
ImageName: bar_chart
Step 6 — Dashboard view
Compose all items in a single Dashboard view. Note the Height property on each item:
Type: Data
DisplayLabel: _(Activity Dashboard)
ImageName: dashboard
Controller: Dashboard
  Gap: 12
  MaxColumns: 4
  RefreshInterval: 60
  Items:
    View: DashKpiActivities
      Flex: 1
      MinWidth: 180
      Height: 180
      Footer: _(Current calendar month)
    View: DashKpiHours
      Flex: 1
      MinWidth: 180
      Height: 180
      Footer: _(Current calendar month)
    View: DashKpiProjects
      Flex: 1
      MinWidth: 180
      Height: 180
      Footer: _(All projects with Open status)
    View: DashKpiCustomers
      Flex: 1
      MinWidth: 180
      Height: 180
      Footer: _(Distinct customers with activities this month)
    View: DashStatusPie
      Flex: 2
      MinWidth: 400
      Height: 350
      Footer: _(Activities grouped by status in the current month)
    View: DashTypePie
      Flex: 1
      MinWidth: 300
      Height: 350
      Footer: _(Total hours grouped by activity type, all time)
    View: DashDailyChart
      Flex: 1
      MinWidth: 700
      Height: 300
      Footer: _(Daily hours from 15 days before to 15 days after today)
The layout produces three rows:
- Row 1 — 4 KPI cards at 180px height, each 25% wide (MaxColumns: 4)
- Row 2 — 2 charts at 350px height (Flex: 2 + Flex: 1 → 66% + 33%)
- Row 3 — 1 trend chart at 300px height, full width
Step 7 — Add to menu
Add the Dashboard view to MainMenu.yaml:
Folder: _(Statistics)
  View: Dashboard
  View: ActivityPieChart
  View: ActivityBarChart
KPI card CSS
Kittox includes built-in CSS classes for KPI cards:
| Class | Description |
|---|---|
.kx-kpi-card | Flex row container with centered alignment |
.kx-kpi-icon | Left-aligned icon area with fixed 72×72px dimensions and flex-shrink: 0 |
.kx-kpi-body | Value and label container |
.kx-kpi-value | Large accent-colored number (2.5em, bold) |
.kx-kpi-label | Muted description text below the value |
The .kx-kpi-icon supports both <img> elements (from {_IMAGE}) and .kx-icon spans (from {_ICON}).
See also
- FlexPanel — Base container controller (without auto-refresh)
- TemplateDataPanel — Template-based rendering for KPI cards
- ChartPanel — Chart views for dashboard items
- TasKitto — Sample application with Activity Dashboard