
Charts
Charts are drawn by Mermaid, the same JavaScript library of the mermaid diagrams: the data of the chart are written as text in a mermaid code block, and the chart is drawn as an SVG image when the page is shown. No spreadsheet and no image to export: to change a value you edit the text of the document.
Charts in Markdown
A chart is a fenced code block with the language mermaid; its first word chooses the kind of chart:
```mermaid
pie title Markdown dialects
  "GitHub" : 45
  "GFM" : 25
  "CommonMark" : 20
  "Legacy" : 10
```
As for all the mermaid diagrams, the Markdown Processor writes the block as <pre class="mermaid"> (extension mexMermaid, enabled in the GitHub dialect, the default) and the chart is drawn by:
- the Markdown Help Viewer and the preview of the Markdown Text Editor (with Microsoft Edge WebView2);
- the TEdgeMarkdownViewer component, in your Delphi applications (Delphi 12 and 13).
The Preview Panel of Windows Explorer, the TMarkdownViewer component and the viewers without WebView2 show the source text of the chart.
The charts are drawn also without an Internet connection: Mermaid 11.17.2 is installed with the tools, in the Scripts folder.
The kinds of chart
| Chart | First line | Useful for |
|---|---|---|
| Pie chart | pie | the parts of a total |
| XY chart | xychart-beta | bar and line charts, also together and horizontal |
| Quadrant chart | quadrantChart | items placed in four quadrants by two values |
| Sankey | sankey-beta | flows from sources to targets, with their quantities |
| Radar | radar-beta | compare items on several axes |
| Treemap | treemap-beta | hierarchical data as nested rectangles |
Examples
Pie chart
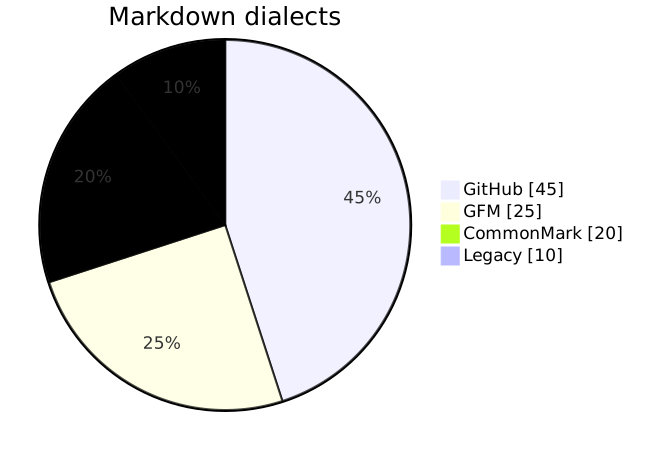
showData shows the values next to the labels:
```mermaid
pie showData
  title Markdown dialects
  "GitHub" : 45
  "GFM" : 25
  "CommonMark" : 20
  "Legacy" : 10
```
Bar and line chart
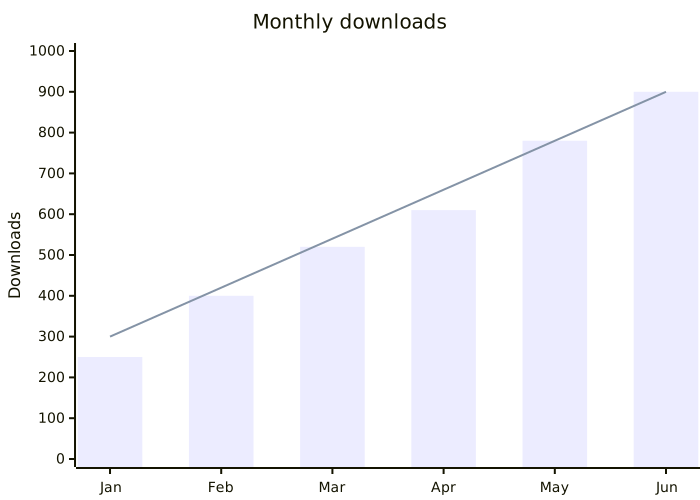
Bars and lines can be drawn in the same chart (here the downloads and the target); xychart-beta horizontal draws horizontal bars:
```mermaid
xychart-beta
  title "Monthly downloads"
  x-axis [Jan, Feb, Mar, Apr, May, Jun]
  y-axis "Downloads" 0 --> 1000
  bar [250, 400, 520, 610, 780, 900]
  line [300, 420, 540, 660, 780, 900]
```
Quadrant chart
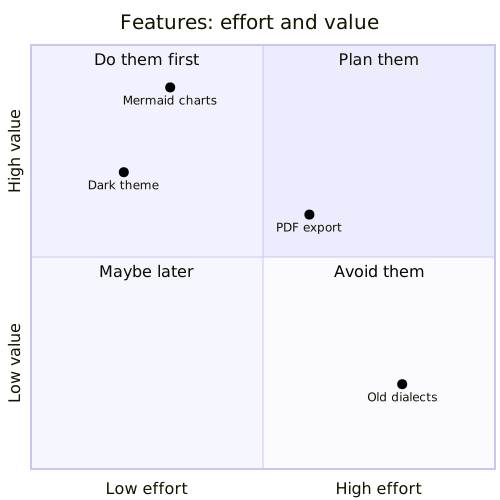
```mermaid
quadrantChart
  title Features: effort and value
  x-axis Low effort --> High effort
  y-axis Low value --> High value
  quadrant-1 Plan them
  quadrant-2 Do them first
  quadrant-3 Maybe later
  quadrant-4 Avoid them
  Dark theme: [0.2, 0.7]
  Mermaid charts: [0.3, 0.9]
  PDF export: [0.6, 0.6]
  Old dialects: [0.8, 0.2]
```
Sankey
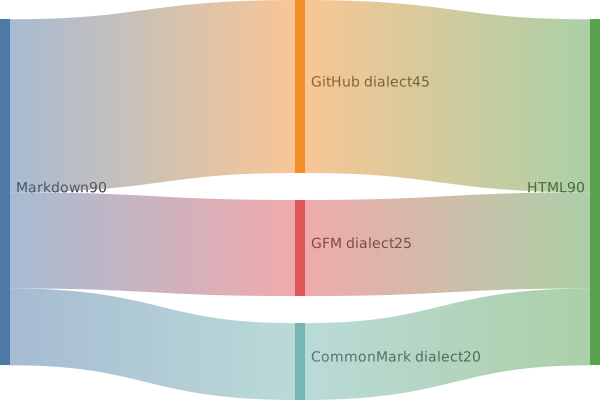
Each line is source,target,value:
```mermaid
sankey-beta
Markdown,GitHub dialect,45
Markdown,GFM dialect,25
Markdown,CommonMark dialect,20
GitHub dialect,HTML,45
GFM dialect,HTML,25
CommonMark dialect,HTML,20
```
Radar
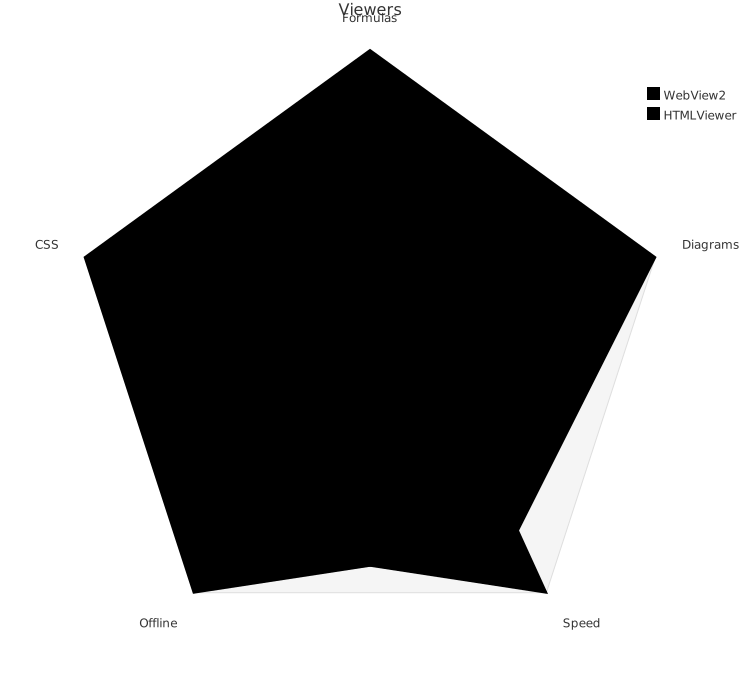
The options of a diagram can be written in a config block at the beginning (here the margins, so that the labels of the axes are not cut):
```mermaid
---
config:
  radar:
    axisLabelFactor: 1.08
    marginLeft: 70
    marginRight: 70
---
radar-beta
  title Viewers
  axis f["Formulas"], d["Diagrams"], s["Speed"], o["Offline"], c["CSS"]
  curve e["WebView2"]{5, 5, 4, 5, 5}
  curve h["HTMLViewer"]{3, 1, 5, 4, 3}
  max 5
  graticule polygon
```
Treemap
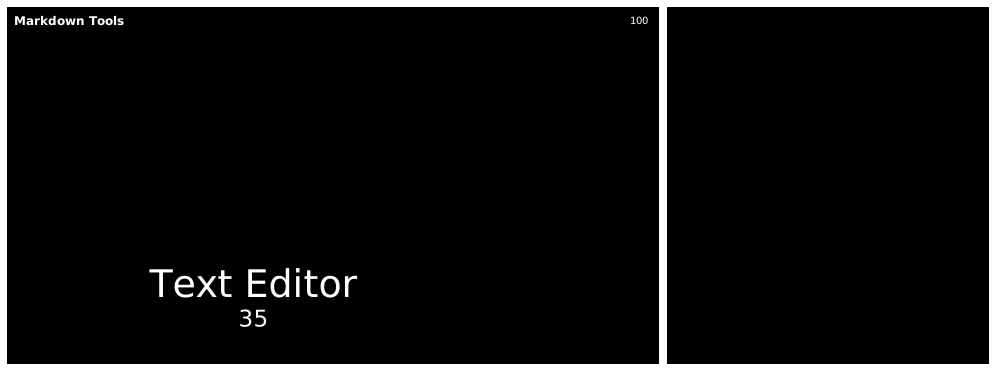
```mermaid
treemap-beta
"Markdown Tools"
    "Help Viewer": 40
    "Text Editor": 35
    "Shell Extensions": 25
"Libraries"
    "Markdown Processor": 50
```
Learn more
All the options of each chart (titles, axes, colors, sizes, themes) and many examples are in the official documentation of Mermaid: mermaid.js.org. To try a chart before writing it in a document, use the online editor mermaid.live.
The charts marked as -beta can change in the next versions of Mermaid: the documentation of the version used by the tools (11.17.2) is the reference.